
Starbucks Global Expansion Analysis (Tableau)
A deep dive into Starbucks' expansion strategy using geospatial data and business intelligence techniques.
Technical Approach:
Merged Starbucks store location data from multiple sources.
Used Tableau’s geospatial visualization tools to analyze market penetration.
Conducted comparative analysis between company-owned vs. licensed stores
Skills Applied: Tableau | Geospatial Analysis | Business Intelligence | Market Research.
/ul>

🚴 Cyclistic Bike-Share Analysis (R & PowerPoint)
Slide-based data storytelling using R and real-world bikeshare data.
Technical Approach:
This project explores user behavior within Cyclistic’s bike-share system using ride data from 2019 and 2020. Using R for data cleaning, transformation, and visualization, I identified usage trends between casual riders and annual members. The final PowerPoint presents key findings through violin plots, heatmaps, and treemaps—supported by actionable recommendations to improve user engagement and boost memberships.
Skills Applied: R Programming | Data Cleaning | Data Visualization | Geospatial Analysis | R Markdown | PowerPoint
Excel & CSV Handling | User Behavior Analysis | Storytelling with Data | Problem Solving | Presentation Skills
Tools: ggplot2, dplyr, readxl, readr, lubridate, hms, geosphere, treemapify
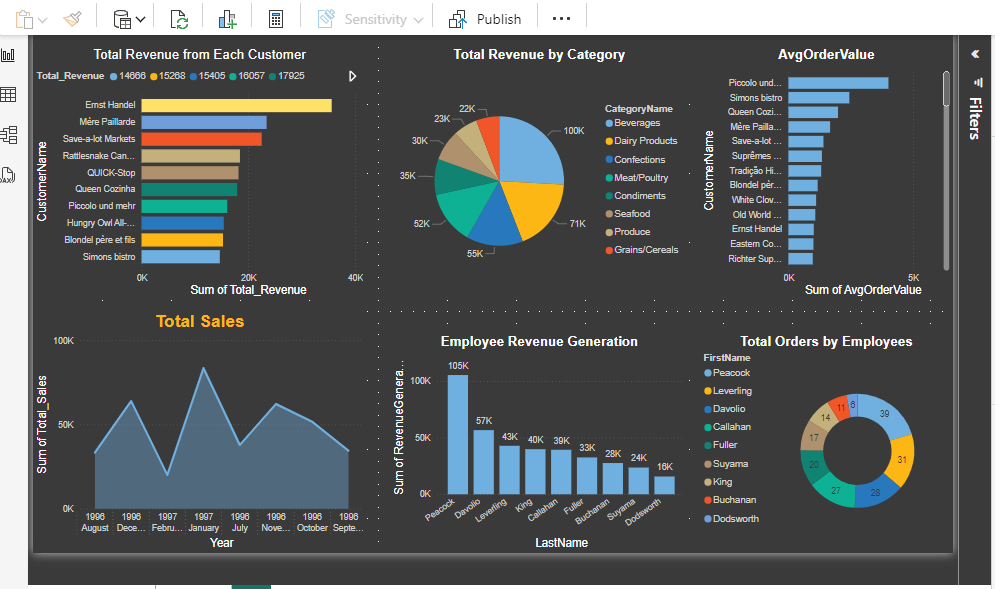
Retail Sales Performance Dashboard (Northwind Dataset - Power BI)
This interactive dashboard provides a comprehensive view of retail sales performance, enabling businesses to make data-driven decisions.
Technical Approach:
Extracted and transformed sales data from the Northwind dataset using SQL.
Designed an interactive Power BI dashboard using DAX formulas and data modeling to create meaningful KPIs.
Implemented various visualizations, including bar charts, area charts, and pie charts, for trend analysis
Skills Applied: SQL | Power BI | Data Modeling | DAX | Business Intelligence.
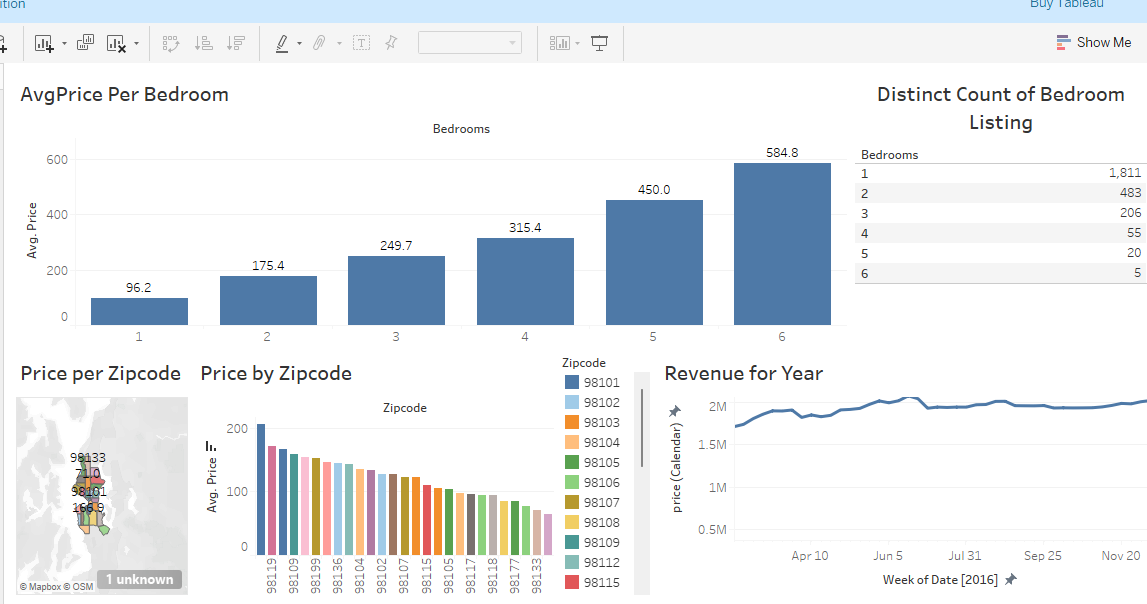
Airbnb Market Analysis Dashboard (Tableau)
This Tableau dashboard provides an in-depth analysis of Airbnb market trends, pricing strategies, and property distribution.
Technical Approach:
Cleaned and transformed Airbnb listing data using SQL.
Built an interactive Tableau dashboard with geospatial visualizations, time series charts, and statistical modeling.
Analyzed seasonal trends, pricing strategies, and geographic variations
Skills Applied: SQL | Tableau | Data Cleaning | Market Analysis | Geospatial Visualization
.

Pizza Sales Performance Dashboard (SQL & Power BI)
A detailed sales dashboard analyzing pizza sales trends to improve menu offerings and optimize business performance.
Technical Approach:
Extracted transactional data using SQL and transformed it using Power BI.
Created interactive filters for deep-diving into order trends, revenue, and customer preferences.
Designed a KPI-driven layout for quick insights
Skills Applied: Power BI | SQL | Sales Forecasting | Data Transformation | BI Reporting.
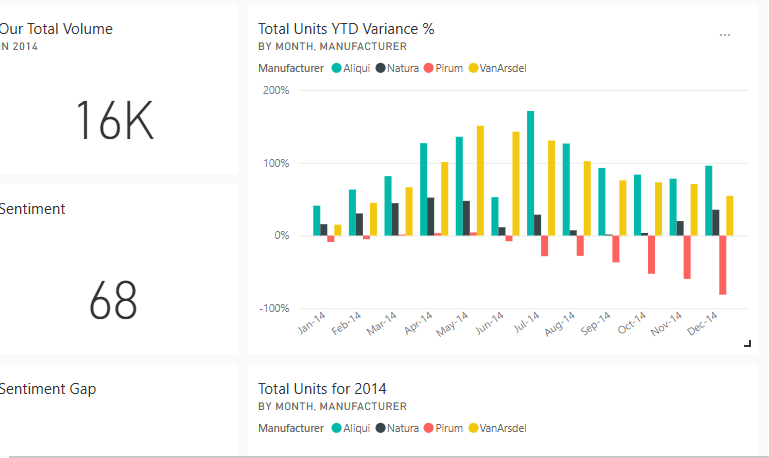
Red 30 Sales Analysis
I recently conducted an in-depth analysis of the Red 30 sales report using Power BI, leveraging its powerful visualization and data modeling capabilities to uncover key insights. The dashboard provides a comprehensive view of sales performance, including total volume, sentiment analysis, variance trends, and market share distribution.
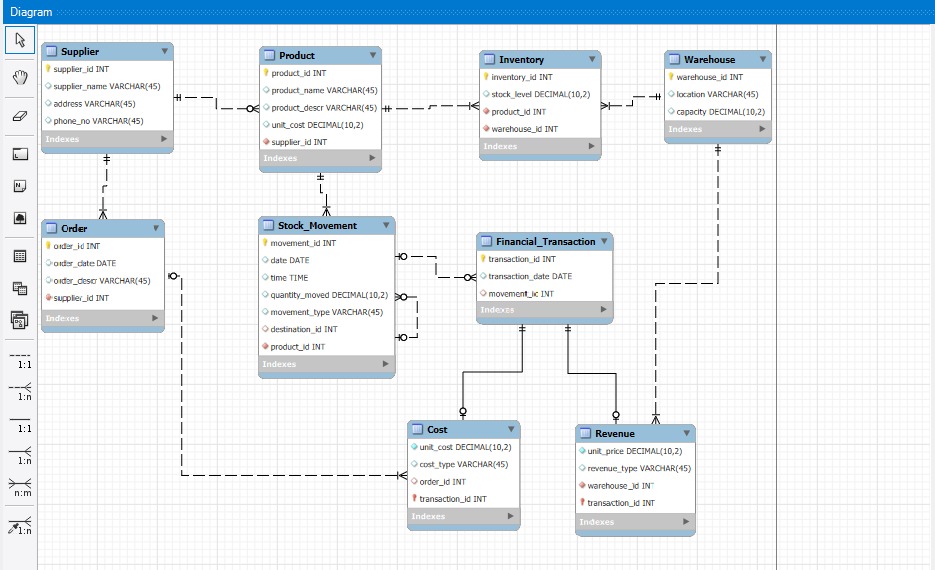
Warehouse Management EER Diagram
This is an Enhanced Entity-Relationship (EER) Diagram that I designed to illustrate a Warehouse Management System. It showcases the relationships between key entities such as Suppliers, Products, Inventory, Orders, Financial Transactions, and Stock Movements. This structure ensures efficient tracking of inventory, cost management, and revenue monitoring within a business.
By leveraging database design principles, I ensure data is structured, optimized, and scalable for various applications, from warehouse logistics to e-commerce platforms..